
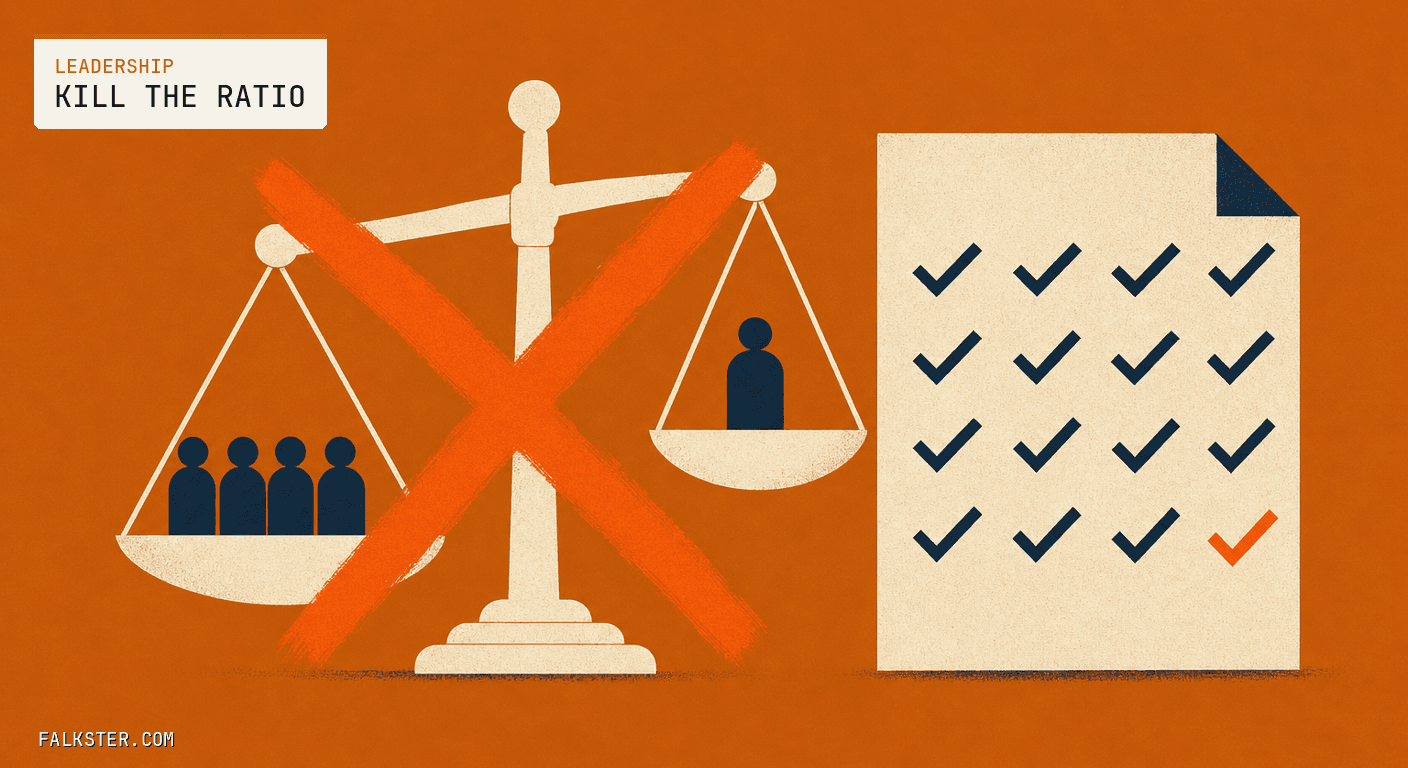
Lenny Rachitsky published his late-2026 job market report this morning, and the design numbers in it are a record low. This is a Kill List entry: the ratio everyone will quote from it, 3.8 open PM roles for every open design role, measures a job that stopped existing, and the number to put in its place is countable.
The short version
- Lenny's report, from TrueUp and Live Data Technologies data as he reports it, has about 1,900 open product design roles globally, down 28% in a year, about 12,600 US product designer hires in the past twelve months against 27,600 in 2022, and 3.8 open PM roles for every open design role, up from 1.9 in early 2023.
- He reads it as design losing and hopes companies rediscover design as a differentiator. The PM-to-designer ratio was a production ratio, one designer drawing what several PMs specified, and Figma's own randomized trial, as Jakob Nielsen reported it, moved the drawing: AI cut PM time 35% and designer time 17%, closing about 70% of the gap between the roles.
- When PMs produce design work the ratio rises on its own and says nothing about whether the work is good. Kill the ratio as the design health number.
- Count the share of live surfaces with a current rubric, the page I use instead of a PRD with three to five criteria and at least 20 test cases graded pass or fail, which a PM's prototype arrives scored against.
- In my ownership map design owns six of thirteen rows, and none of them is reviewing the PM's prototype. Count the surfaces, then decide how many designers.
What Lenny published
The report is his second of 2026 and, he says, the most surprising of the five he has done. It draws on two datasets: TrueUp, which tracks open roles at more than 9,000 tech companies, and Live Data Technologies, which tracks job changes for 124 million professionals and supplies the US hiring numbers. Takeaways 1 to 6 are public. Takeaway 7, on growth outside software, is behind the paywall and I have not read it.
PMs are winning. Open PM roles are up 75% from the March 2023 low, PM openings have grown faster than any other core role since the start of 2023, and PM is the only core role whose share of hiring grew, from 16% in 2021 to 21% today. Engineering demand has stalled for the first time in the history of the report: openings grew 29% through 2024, 15% through 2025, and 2.5% this past year, and US companies hired about 113,000 software engineers in the twelve months to April 2026, less than half the 2022 peak of 239,000. Forward deployed engineer openings are up 4.6x in a year to around 1,500, which he says is partly real demand and partly "sales engineer" rebranded.
Then design. About 1,900 open product design roles globally, the lowest since he started tracking and down 28% from a year ago. About 12,600 US product designer hires in the past twelve months, against 27,600 in 2022, falling every year since. And the line everyone will quote: 3.8 open PM roles for every open design role, up from 2.6 earlier this year and 1.9 in early 2023. The hiring data says 2.9 PMs hired per designer, up from 1.9 in 2022. User research is hit harder, with about 1,800 US hires in the past year, down 66% from 5,300 in 2022, and 108 open UXR jobs globally.
3.8 to 1
His theory is pace: "the increasing pace of product development is responsible," there is less time for the traditional design process, and teams release earlier and learn after launch. His hope is that companies recognize "great design can be a huge differentiator" in a market full of AI slop.
And one line he flags as a narrative violation. Demand for Figma in designer job descriptions has grown for three years, and "Claude" became the second most mentioned skill in designer JDs this spring, ahead of CSS.
That is a careful report with its sources named, and I have no quarrel with the data.
What the ratio measured
The PM-to-designer ratio was never a quality number. It was a production number.
A PM specified a feature and a designer drew it. If three PMs specified faster than one designer could draw, screens queued, and the ratio told you so. Boards and VPs argued about it because the drawing capacity was the constraint and the ratio was the easiest way to see whether it matched the specifying capacity.
Figma ran the experiment that broke that. As I wrote in Figma's Trial Closed 70% of the PM Gap. The Gate Is the Rubric, Not the Designer., the randomized trial of Figma Make, as Jakob Nielsen reported it on October 19, put 50 product managers and 50 product designers through the same three design tasks. AI cut the PMs' time 35% and the designers' 17%, closing roughly 70% of the gap between the roles.
When PMs can produce the first draft of the design, the drawing capacity moved to their side of the line. Then 3.8 is what the ratio does. It is not a verdict on design. It is the ratio reporting that drawing got cheap, which is the same thing chapter 1 of my design handbook, Design Just Got Promoted, says in its first paragraph: drawing got cheap, deciding did not.
Lenny's narrative violation points the same way. If the role count fell while Figma demand rose, the designer still being hired is the one who runs the tool, and since this spring the one who runs the model. The job did not shrink. The drawing part of it did.
So the ratio can go up for two opposite reasons. A company where PMs ship scored prototypes and two designers hold the rubrics for forty surfaces. Or a company that cut design, let PMs ship whatever the model drew, and will find out in the repair rate. The ratio reads 3.8 in both. That is why it has to go.
The number to count
Count the share of live surfaces with a current rubric.
The rubric is the page I use instead of a PRD, and the sizes are in the Figma post: three to five criteria, at least 20 test cases, graded pass or fail per dimension. The method for writing one is The Rubric Is the Spec: grade thirty real outputs on gut feel first, keep the dimensions that repeat in your own reasoning, and bin each one pass or fail with a severity, because a five-point scale lets two reviewers write 3 for different reasons and believe they agreed.
A PM's prototype, four to six hours in my practice, arrives scored against that page. The designer's time goes to the rows no rubric holds yet: the unsure state, the refusal, the undo for an action an agent took at 3am. In the ownership map in my design handbook, design owns six of thirteen rows, and none of them is "review the PM's prototype." The Product Leadership thesis is that the org chart was calibrated to a build cost that collapsed and leadership work is deciding which coordination roles stop being necessary. A designer whose job is to look at every PM prototype is a coordination role. A designer who writes the rubric the prototype is scored against is not.
Two numbers, then. How many live surfaces the product has. How many have a rubric written in the last two quarters. The gap is the coverage problem, and it is usually solved with writing before hiring.
Read the ratio next to that count and it becomes useful again. A company with 3.8 PMs per designer and a rubric on every surface is fine; its designers are writing judgment that keeps working on surfaces nobody looks at that week. A company at one to one with no rubric is paying a reviewer to cap the product at what one person can look at, and the Figma trial just raised the volume that person has to look at.
The research line is the same kill
Lenny's user research number is the one I would worry about, and not for the reason he gives.
The 66% drop measures the function that ran studies. It does not measure whether anyone is asking real users a question and recording a verdict. Those two still have to be owned, and the pace argument is an argument for a faster verdict, not for no verdict. I wrote in Five Real Users Beat Fifty Synthetic Ones, If You Ask Them How It Felt what the fast version looks like: five people, one question about how it felt, the same week. If the design team owns the question and the verdict, the research headcount can fall and the product does not get worse. If nobody owns them, the hiring chart will look fine right up to the repair rate.
This week
Count two numbers before anyone shows you the 3.8. How many live surfaces your product has, and how many have a rubric that a PM's prototype arrives scored against. If the second number is most of the first, your ratio can be whatever the market makes it. If it is near zero, you do not have a headcount problem yet. You have a writing problem, and it is cheaper.
Related answer: Is the PM-to-designer ratio the right design health number?
Sources: Lenny Rachitsky, "State of the tech job market: late 2026," Lenny's Newsletter, November 10, 2026, takeaways 1 to 6 read in full; takeaway 7 is paid and is not cited. Every market figure is as he reports it from TrueUp and Live Data Technologies, which I did not open. The Figma Make trial figures are as Jakob Nielsen reported them on October 19, 2026, cited through "Figma's Trial Closed 70% of the PM Gap. The Gate Is the Rubric, Not the Designer." The rubric sizes, the four to six hours, and the six of thirteen rows are my own, from the posts and chapters linked above.
Frequently asked
What does Lenny Rachitsky's late-2026 job market report say about design roles?+
As he reports it on November 10, 2026, from TrueUp and Live Data Technologies data: about 1,900 open product design roles globally, the lowest since he started tracking and down 28% from a year ago; about 12,600 product designers hired in the US in the past twelve months against 27,600 in 2022; 3.8 open PM roles for every open design role, up from 2.6 earlier this year and 1.9 in early 2023; and user research hiring down 66% from 5,300 in 2022 to about 1,800, with 108 open UXR jobs globally.
Why is the PM-to-designer ratio the wrong design health number?+
Because it was a production ratio. One designer drew the screens several PMs specified, and the number said whether drawing capacity matched specifying capacity. Figma's own randomized trial, as Jakob Nielsen reported it, cut PM time 35% and designer time 17% on the same three tasks, closing about 70% of the gap. Once PMs produce design work, the ratio rises on its own and says nothing about whether the work is good.
What should a design leader count instead?+
The share of live surfaces with a current rubric. The one I use is a page with three to five criteria and at least 20 test cases, graded pass or fail per dimension, that a PM's prototype arrives scored against. The gap between surfaces you have and surfaces with a rubric is the coverage problem, and it is usually solved with writing before hiring.
Does this mean companies should hire fewer designers?+
It means the headcount decision comes after the coverage count, not before. A company with 3.8 PMs per designer and a rubric on every surface is fine. A company at one to one with no rubric is paying a reviewer to cap the product at what one person can look at. In my ownership map, design owns six of thirteen rows and none of them is reviewing the PM's prototype.
What about the drop in user research hiring?+
Same kill, one row down. The 66% drop measures the function that ran studies. The question and the verdict still have to be owned, and five real users asked how it felt beat fifty synthetic ones. Lenny's own theory is that pace is responsible, which is an argument for a faster verdict, not for no verdict.
Where does Lenny's data come from?+
TrueUp, which tracks open roles at more than 9,000 tech companies, and Live Data Technologies, which tracks hires, departures, and promotions for 124 million professionals, with hiring figures for the US. He credits Amit Taylor and Alex Hamilton for the data. I did not open either dataset; every market figure here is as he reports it.
Sign in with LinkedIn to leave a comment.
Sign in with LinkedIn